The Ultimate Guide to Software Development Metrics: What to Measure & What Matters

"You can’t improve what you don’t measure," but measuring the wrong things can derail your team. In 2023, a tech giant wasted $10M chasing vanity metrics like lines of code, only to find their software failed users. It is important to consider business goals and user impact while selecting metrics. Also, tracking too many metrics leads to confusion instead of insights.
This guide cuts through the noise, offering a clear framework to track metrics that drive success. By the end, you’ll know exactly what to measure and how to apply it.
Why Measure Software?
Metrics help teams assess quality, progress, and efficiency. Tracking the right trends ensures informed decisions, managed risks, and high-quality software delivered on time and within budget.

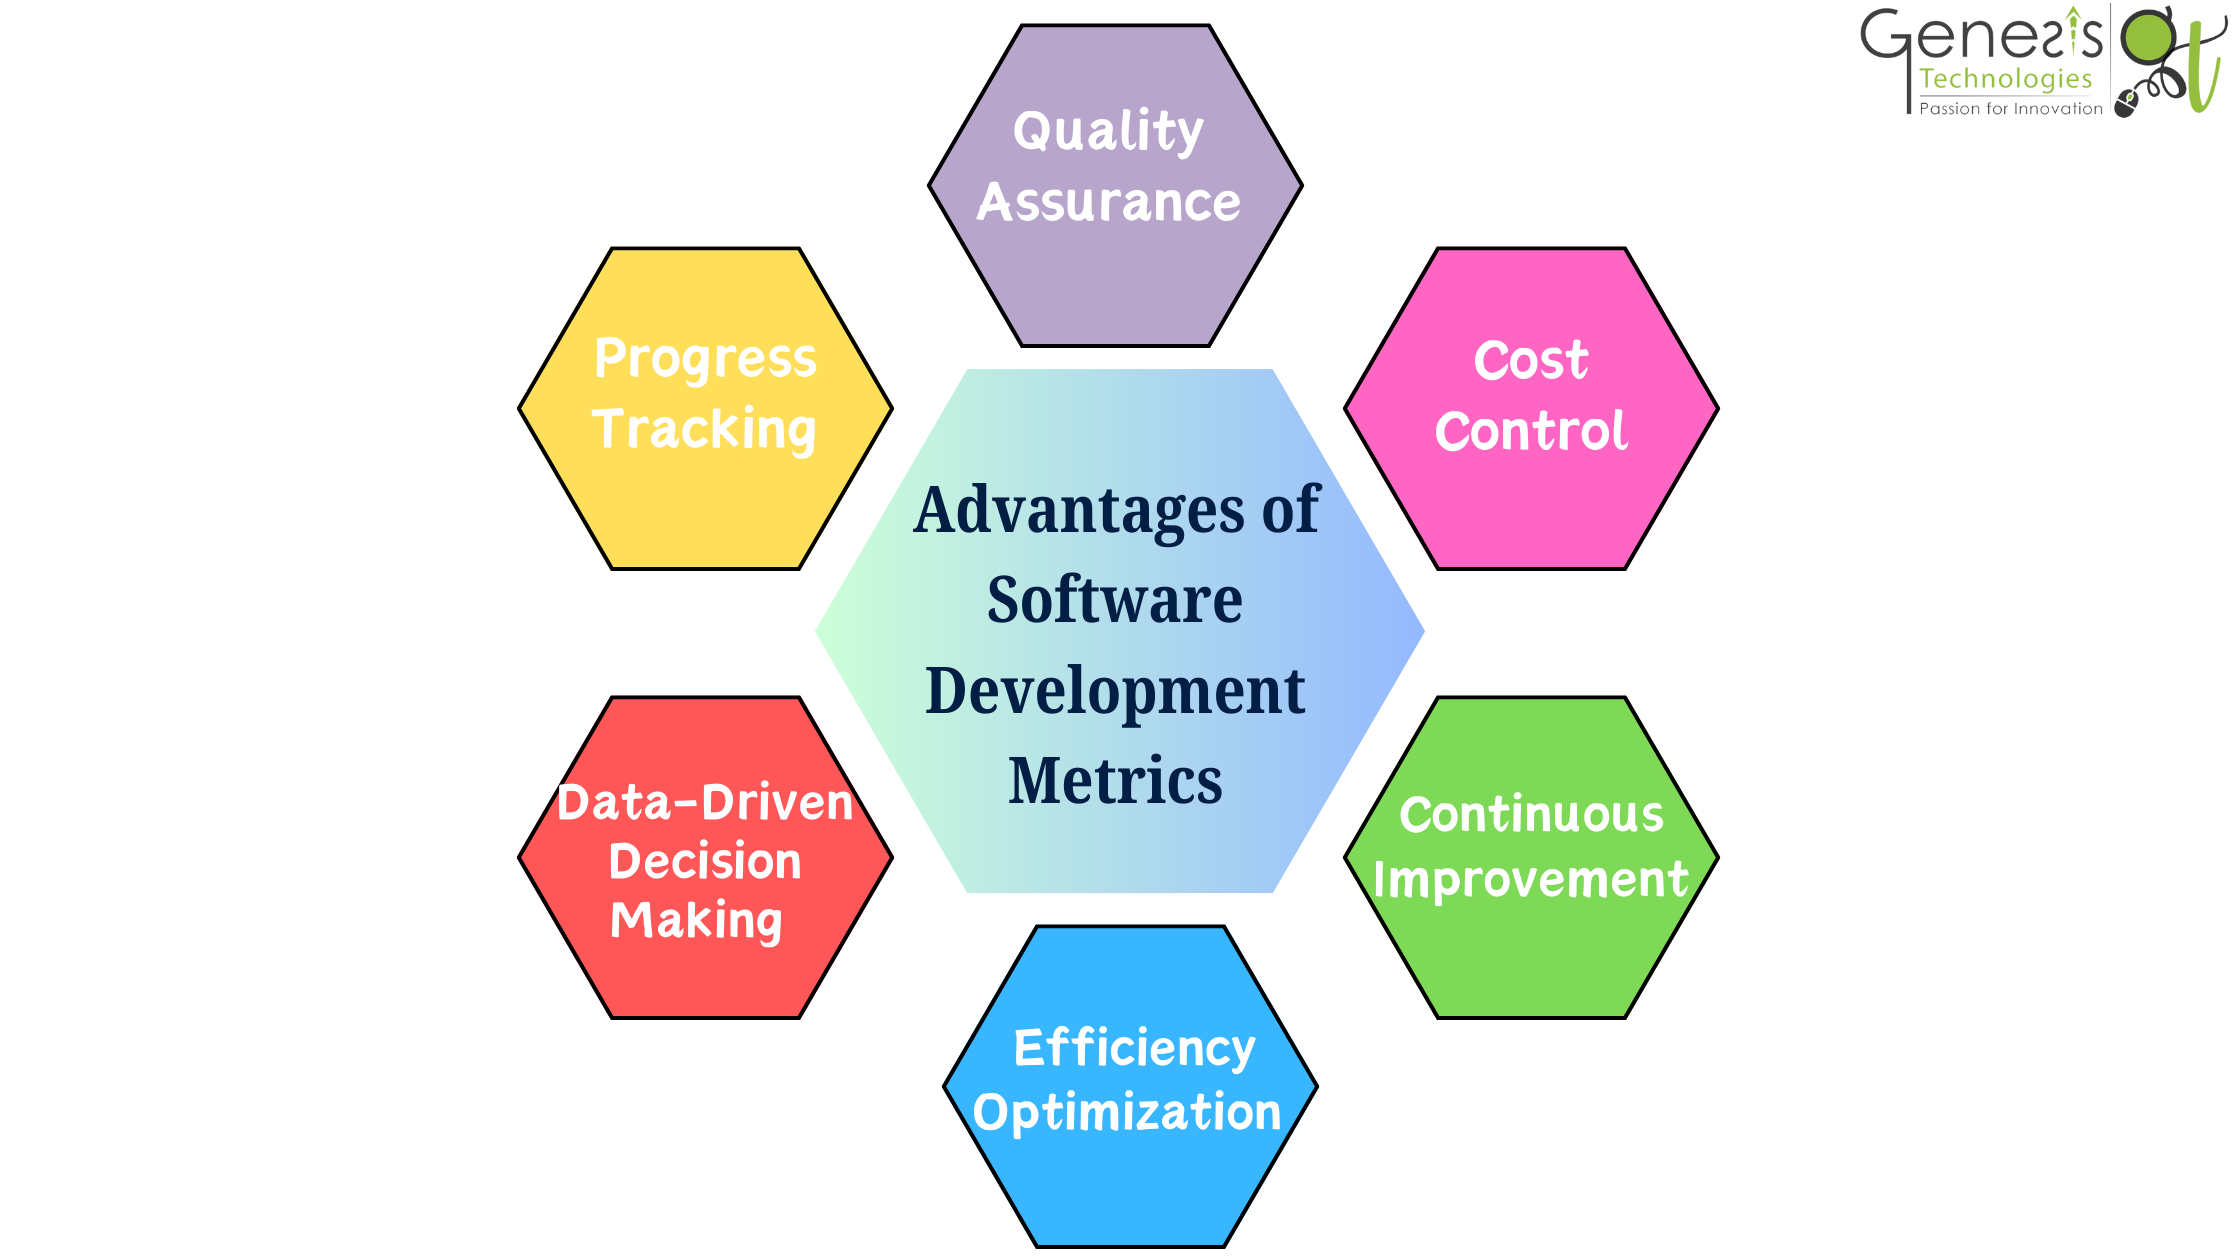
The 4 Pillars of Software Metrics
- Engineering Performance Metrics: Measure efficiency, stability, and speed of delivery.
- Code Quality & Maintainability Metrics: Ensure scalable, stable, bug-free code.
- Product & User Impact Metrics: Gauge real-world success from a user perspective.
- Business & ROI Metrics: Align development with business outcomes.
Each pillar is vital for world-class software. Let’s dive in.
-
Engineering Performance Metricssss
(How Efficiently Does Your Team Deliver?)
High-performing teams deliver stable, quality software at speed. These metrics track efficiency and reliability.
1.1 DORA Metrics (The DevOps Gold Standard) Developed by Google’s DevOps team, DORA metrics are the benchmark for elite teams:
- Deployment Frequency: How often do you deploy to production? (Elite teams deploy multiple times daily.)
- Lead Time for Changes: How fast does a commit reach production? (Shorter = more agile.)
- Change Failure Rate: What percentage of deployments fail? (Lower = more stable.)
- Mean Time to Recovery (MTTR): How long to recover from failures? (Faster = more resilient.)
Why It Matters: The "State of DevOps" report shows elite teams deploy 208x more frequently and recover 2,604x faster than low performers.
How to Improve:
- Automate CI/CD pipelines (e.g., Jenkins, GitHub Actions).
- Use feature flags for safe deployments.
- Monitor with tools like Prometheus for quick issue detection.
1.2 Agile Metrics (For Scrum & Kanban Teams)
Velocity: Story points completed per sprint. (Great for planning, not productivity.)Cycle Time:: Time from task start to completion. (Shorter = smoother flow.)
Lead Time: Time from ideation to delivery. (Shorter = faster response.)
Why It Matters: These predict timelines and reveal bottlenecks.
How to Improve:- Visualize workflows with Kanban boards (e.g., Trello, Jira).
- Limit work-in-progress (WIP) to focus on key tasks.
- Hold retrospectives to refine processes.
1.3 SPACE Metrics (Holistic Developer Productivity) SPACE measures:
- Satisfaction & Well-being: Are developers engaged? (Measure via pulse surveys.)
- Performance: Does software deliver value? (Track user outcomes.)
- Activity: How much work is done? (Monitor commits, PRs.)
- Collaboration: Are teams effective? (Analyze Git patterns, Slack interactions.)
- Efficiency: Are workflows smooth? (Check build times, CI/CD speed.)
Why It Matters: SPACE balances human and technical factors for sustainable productivity.
How to Improve:- Reduce meetings to boost focus time.
- Use tools like CultureAmp for satisfaction surveys.
- Optimize tooling (e.g., fast builds with Bazel).
Code Quality & Maintainability Metrics
(How Healthy Is Your Codebase?)
Speed means nothing if code is buggy or unscalable. These metrics ensure long-term health.
2.1 Code Health Metrics
- Code Churn: How often is code rewritten? (High churn = instability.)
- Defect Density: Bugs per 1,000 lines of code. (Lower = better quality.)
- Escaped Defects: Bugs reaching production. (Fewer = stronger testing.)
- Cyclomatic Complexity: Code logic complexity. (Lower = easier to maintain. Example: A function with 3 if/else statements is simpler than one with 10.)
Why It Matters: Poor code quality leads to technical debt and delays.
How to Improve:- Refactor regularly to reduce churn.
- Automate reviews with ESLint or SonarQube.
- Use static analysis to track complexity.
2.2 Service & App Stability
- Uptime Percentage: Are services available? (Aim for 99.9 %+.)
- Latency: How fast do apps respond? (Lower = better.)
- Error Rates: How often do errors occur? (Lower = more reliable.)
Why It Matters: Stability builds user trust.
How to Improve:- Test with tools like Cypress before deployment.
- Monitor with Datadog or New Relic for real-time insights.
-
Product & User Impact Metrics
(Does Your Software Deliver Value?)
Internal performance is meaningless without user value. These metrics focus on real-world impact.
- Feature Adoption Rate: Percentage using new features. (High = valuable feature.)
- Error Rate: Users facing bugs/crashes. (Lower = better experience.)
- Retention Rate: Users returning after first use. (High = sticky product.)
- Time-to-Value (TTV): How fast users gain value. (Shorter = happier users.)
Why It Matters: User-centric metrics ensure software solves real problems.
How to Improve:- Run A/B tests to optimize features.
- Analyze behavior with Amplitude or Mixpanel.
- Collect qualitative feedback via user interviews (GDPR-compliant).
-
Business & ROI Metrics
(Does Engineering Align with Business Goals?)
These metrics tie development to financial success.
- Development Cost Per Feature: Cost to build features. (Lower = more efficient. Track via Jira time logs.)
- Customer Satisfaction (CSAT, NPS): Are users happy? (Higher = better.)
- Revenue Impact: Metrics like Customer Lifetime Value (CLV) or Expansion Revenue.
Why It Matters: Engineering must drive business value.
How to Improve:- Reduce defects with robust testing.
- Align priorities with business objectives via OKRs.
Choosing the Right Metrics
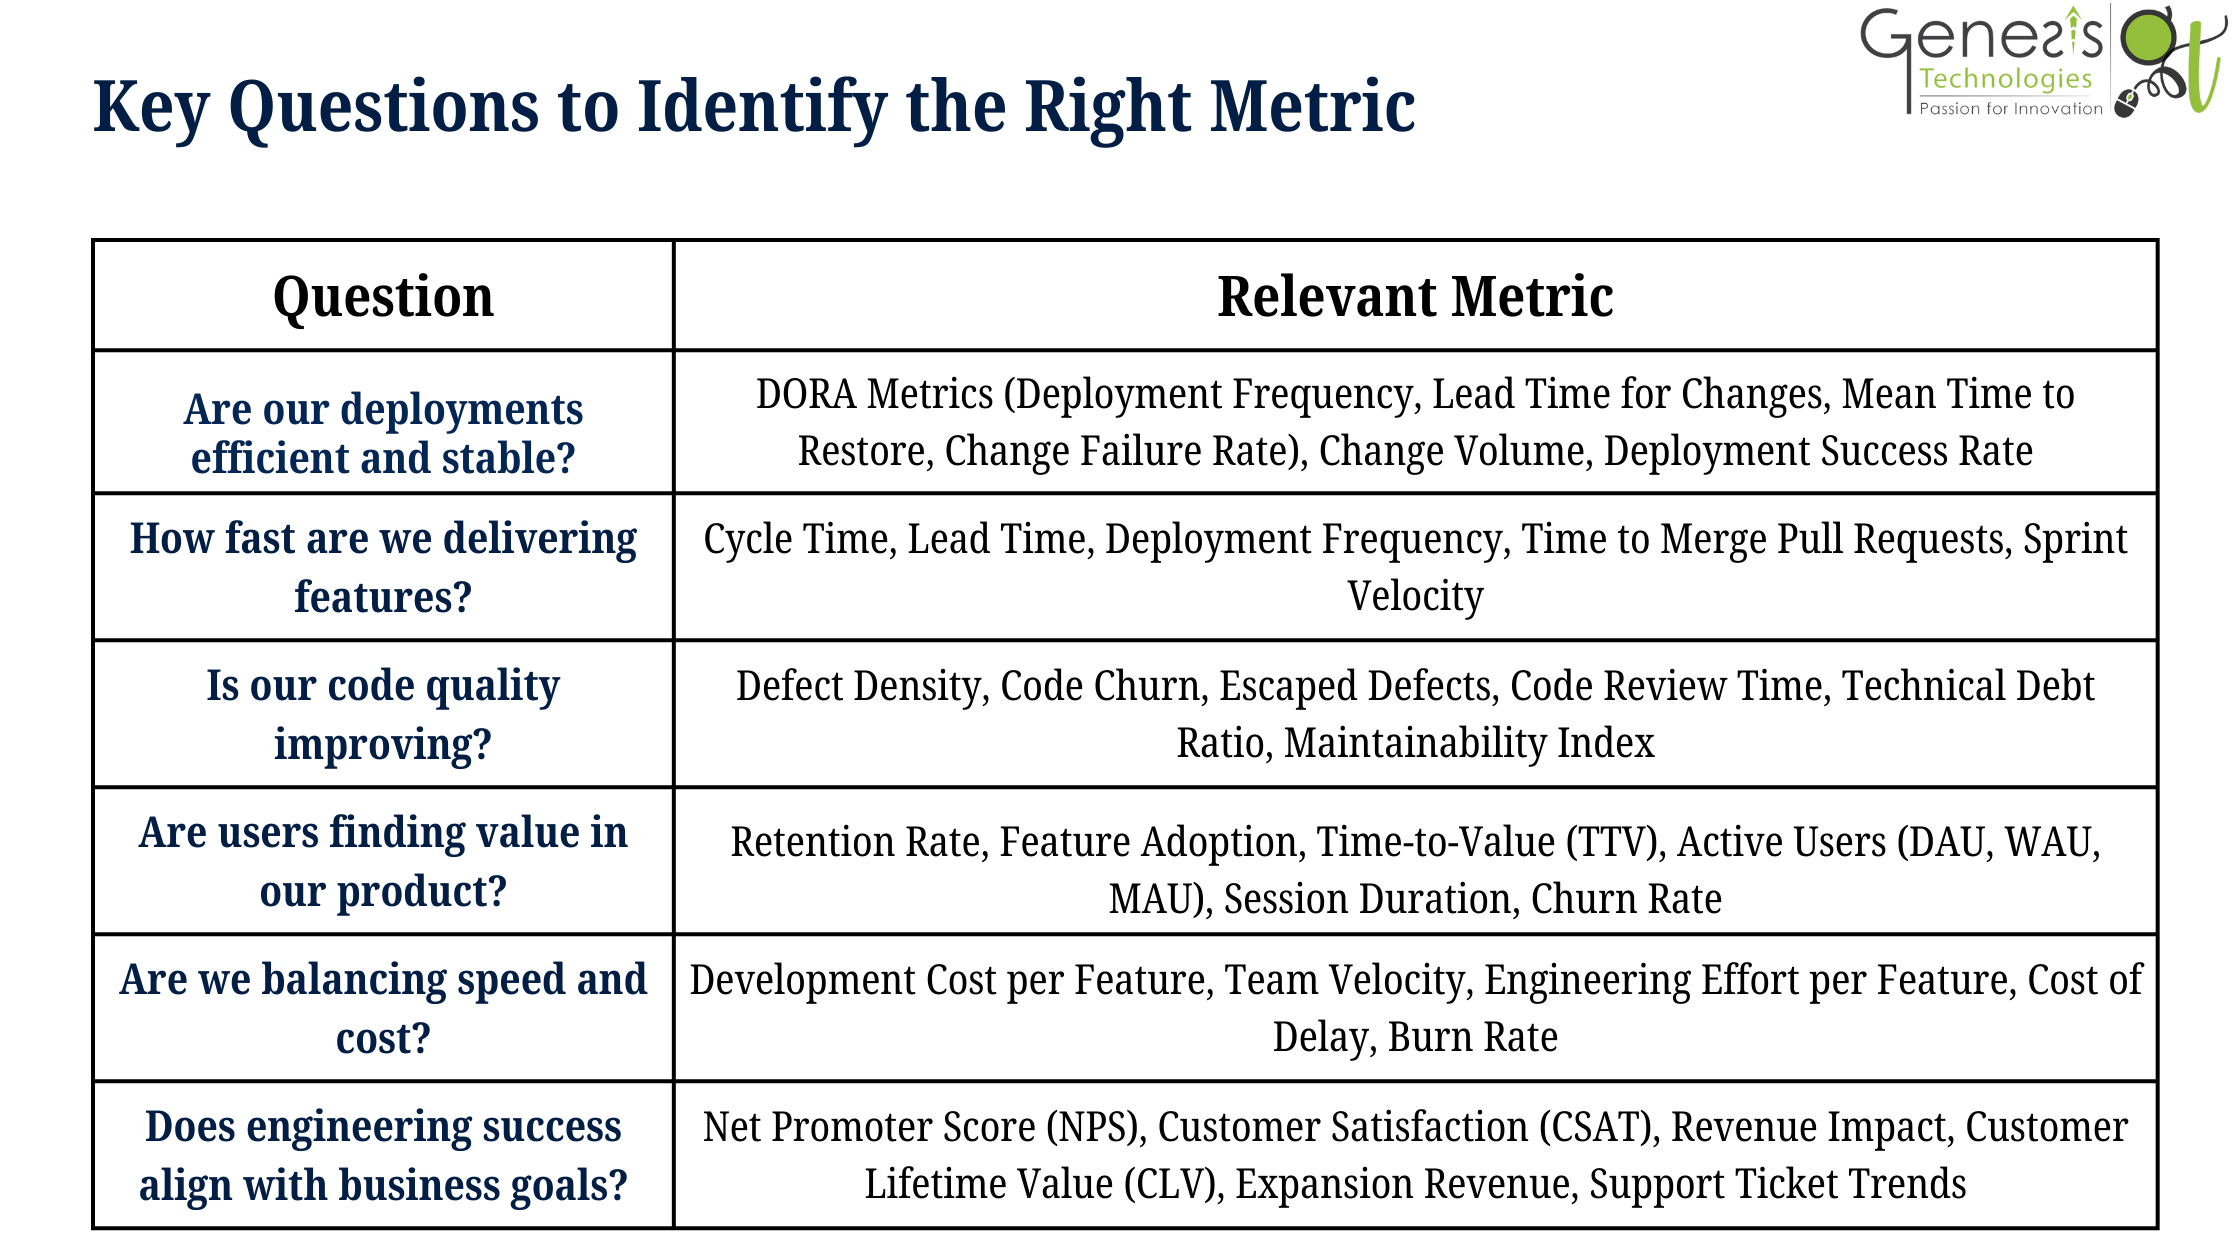
Not all metrics matter equally. Align them with your goals:
- Engineers: Focus on DORA and code quality for speed and stability.
- Product Managers: Track adoption and retention for user impact.
- Leaders: Measure ROI and CSAT for business alignment.
Key Questions Before Tracking:
- Does it solve a real problem?
- Is it actionable?
- Does it measure outcomes, not just activity?

Metrics Selection Table:
| Role | Goal | Recommended Metrics | Example Tools |
|---|---|---|---|
| Engineer | Delivery Speed | Deployment Frequency, Lead Time for Changes | Jenkins, GitHub Actions |
| Product Manager | User Engagement | Feature Adoption Rate, Retention Rate | Amplitude, Mixpanel |
| Executive | Business Impact | Development Cost Per Feature, NPS | Jira, Tableau |
Get Started with Metrics
Follow these steps to implement metrics effectively:
- Identify your team’s top goals (e.g., faster delivery, better user retention).
- Select 3–5 metrics from this guide (e.g., Deployment Frequency, Feature Adoption Rate).
- Choose tools to track them (e.g., SonarQube for code quality, Mixpanel for user analytics).
- Review monthly and adjust based on outcomes.
- Share insights with your team to align efforts.
Conclusion: Measure What Moves the Needle
In software development, what you measure shapes what you improve. Tracking the wrong metrics wastes time and resources. By focusing on actionable, outcome-driven metrics, your team can streamline workflows, build better software, and deliver real value.
Start small, measure smart, and watch your team thrive.
Key Terms Glossary
- Cyclomatic Complexity: A measure of code complexity based on decision points (e.g., if/else statements).
- DORA Metrics: Industry-standard metrics for DevOps performance, including Deployment Frequency and MTTR.
- Technical Debt: Future costs from quick, suboptimal code fixes.
- Time-to-Value (TTV): How quickly users gain value from software.


